Mendelian Genetics
Lab Assignment
In this lab you'll use a test system of corn cobs and a couple of specific tools - the Punnett square and the chi-squared statistical test - to practice making hypotheses and predictions, and to analyze results in order to determine if the results of an experiment match your predictions, and in turn whether the results support your hypotheses.
Good hypotheses generate testable predictions; that is, you should be able to use a hypothesis to predict the results you will observe in a particular experiment if the hypothesis is correct. In order for a prediction to be testable, it must be expressed in terms of observable results.
How do you get from hypothesis to testable prediction? In this week's lab, you will be using the Punnett square as a tool that allows you to use a hypothesis about inheritance (for example, "trait X is dominant over trait Y", or "the parents of this group of offspring had the genotypes Bb and bb") to generate a testable prediction about phenotypic ratios in the offspring of a particular cross.
It is often helpful to remember the logical relationships between hypothesis, experiment, and prediction as an if/and/then statement:
IF the hypothesis is correct, AND a specific experiment is performed, THEN a specific result should be observed from the experiment.
After completing this activity and the relevant readings from the textbook, you should be able to:
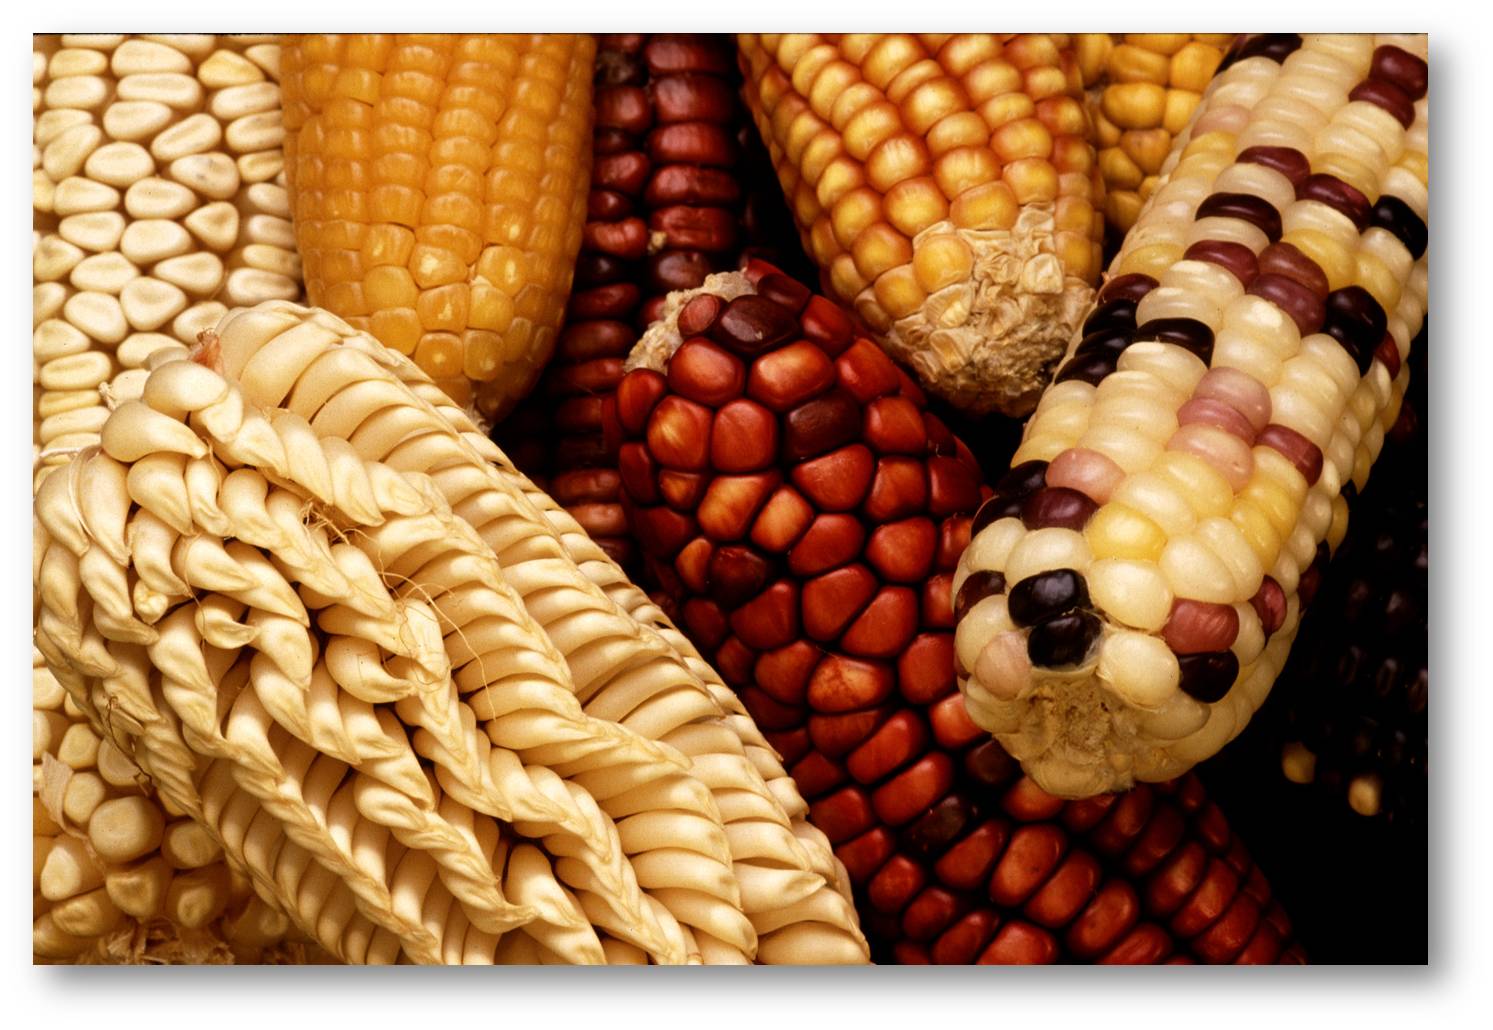
Germplasm Enhancement for Maize (GEM) project By Keith Weller, USDA [Public domain], via Wikimedia Commons
You can practice with hypotheses and predictions with the scenarios on this page. The warm-up exercises are for your own notes and to help you with the rest of the lab; you will not be submitting them with the lab assignment itself.
Assume that fur colour in cats is associated mainly with a single gene with two alleles, G and g. Your hypothesis is that grey fur colour is dominant over orange fur colour. Your experiment is to cross two cats of known genotype Gg. Use a Punnett square to generate a testable prediction: what phenotypic ratio is expected from this experiment, if your hypothesis is correct? Remember that the Punnett square is not the prediction itself, because you are not able to observe genotypes directly - the Punnett square is a tool that allows you to generate a prediction from a given hypothesis and experiment.
Print this page or sketch the table below in your notes and fill it in to make your Punnett square. (You many not necessarily need to fill all the cells in the table.) After completing the Punnett square, state your prediction in a single sentence.
(5x5 table)
|
|
|
|
|
|
|
|
|
|
|
|
|
|
|
|
|
|
|
|
|
|
|
|
|
|
|
|
|
|
Check your Punnett square.
Check your prediction.
Now let's consider an additional character in cats: fur length. Short fur (F) is dominant over long fur (f). Two parents, both of genotype GgFf, are crossed and the offspring phenotypes are observed.
What is the full hypothesis for this scenario (taking into account that information from Scenario 1 is also relevant)? What is the experiment?
Check your hypothesis.
Check your experiment.
Use a Punnett square to generate a testable prediction for the outcome of this experiment if the hypothesis is correct. After completing the Punnett square, state your prediction in a single sentence.
(5x5 table)
|
|
|
|
|
|
|
|
|
|
|
|
|
|
|
|
|
|
|
|
|
|
|
|
|
|
|
|
|
|
Check your Punnett square.
Check your prediction.
In this lab, you will be studying the genetics of corn. For this scenario, assume that purple colour is dominant over yellow colour in corn kernels.
You find some corn plants growing on the edge of a field. All of the kernels of corn on these plants are purple, and you take one of these kernels and grow it into a mature corn plant. Is this plant true breeding for the purple colour, or is it a hybrid? You decide to cross this plant with a true-breeding yellow kernel corn plant to find out.
Choose letters to represent the alleles in this scenario. What is your hypothesis about the genotype of the purple kernels? Fill in the blank in the statement below by using a Punnett square to generate a prediction.
IF [your hypothesis] is correct, AND a purple corn plant is crossed with a yellow corn plant [the experiment], THEN the resulting offspring should have an observable phenotypic ratio of __________________.
Check your hypothesis.
Check your Punnett square and prediction.
In this lab, you will be doing a statistical test called the chi-squared test to decide whether or not to reject your hypothesis based on the observations that you make. To begin, review the Statistics In Introductory Biology document, available from the assignment dropbox for this lab (this is the same document that you used for the Cells and Diffusion lab).
If you have not performed a chi-square test before, you may also wish to view the Understanding and Using the Chi-Squared Test video. (Note that this video was recorded for a similar lab in BIOL 1010, and may refer to other labs or activities that aren't relevant to this class; you can ignore these references.)
In your notes, answer the following question based on the reading and the video.
1. If your hypothesis gives a prediction of 3 curly-petal plants to 1 flat-petal plant, and you observe a total of 468 plants, how many curly-petal plants do you expect to see? Support your answer.
Check your answer to Question 1.
Consult the section of the Chi-Squared Critical Values table pictured below, and answer the questions that follow to make sure that you are comfortable interpreting this table. If you're not sure how to read the table, watch the Understanding and Using the Chi-Squared Test video for an example.

2. For a chi-squared value of 7.16, with one degree of freedom, what is the corresponding p-value?
Check your answer to Question 2.
3. Explain in words what "p = 0.25" means in the chi-squared test.
Check your answer to Question 3.
On a cob of corn, each kernel has resulted from an independent fertilization event. Each kernel therefore is like one child, and each cob is like a family of siblings, all with the same parents. By observing a group of kernels on the same cob, you can observe a single generation of offspring resulting from a single cross. This is why corn cobs are a useful way to study Mendelian ratios in genetics.
Colour (purple or yellow) and texture (smooth or wrinkled) of corn kernels can each be associated with single genes. Assume that each of these traits has two alleles, one dominant and one recessive. In this lab, you will be coming up with hypotheses about the inheritance of these traits in corn. You will then use your hypothesis to generate a prediction about the outcome of an experimental genetic cross. To move from your hypothesis to an experimentally testable prediction, you will make use of Punnett squares, just as you did in the warm-up exercises. The resulting offspring (corn kernels) from these genetic crosses are pictured on the following pages. You will observe the phenotypes of these offspring to see how well the actual, observed results match with the results predicted by your hypothesis. (Remember that you cannot directly observe genotype, only phenotype!) If the observed results do not match the predicted results closely enough, you will reject your hypothesis. If the observed results do match the predicted results closely enough, then you will not reject your hypothesis.
But how close is "close enough"? Even if your hypothesis is a good one, the observed and predicted numbers of kernels of a particular phenotype will probably not match exactly: there will be a bit of variation due to chance. In this lab, you will do a statistical test called the chi-squared test of goodness of fit. This is a mathematical way of saying whether or not your observed and expected results match closely enough for you to hang on to your hypothesis (that is, to "not reject" it - in statistics we never support or verify a hypothesis, we merely fail to reject it).
At the end of your chi-squared test, you will end up with a p-value: this is a value that tells you how likely it is that the difference between what you observed and what you expected is due to chance alone (rather than being due to your hypothesis being wrong!). If your p-value is large, then you do not reject your hypothesis: for example, a p-value of 0.5 tells you that there is a 50% probability that the difference between observed and expected results was due to chance - so you won't reject that hypothesis. If your p-value is small (less than 0.05, which means less than a 5% chance that the difference between observed and expected results was due to chance), then you will reject your hypothesis. The differences between what you observed and what you expected to observe were probably due to an incorrect hypothesis, rather than to chance alone.
You used the ImageJ in the Cells and Diffusion lab to measure diameters of red blood cells, and you will need it again in this lab to count corn kernels of different types (yellow, purple, smooth, wrinkled, etc.). This time you will have to download and install the entire ImageJ program, as the Cell Counter function that you will be using is not available on the applet. Download and installation, however, is fast and easy:
1. Start by going to http://imagej.nih.gov/ij/ to download the program.
2. Download the ImageJ package and extract the ImageJ directory as instructed.
3. Start the program; a small ImageJ dialog box will appear on your screen (upper right in the screen cap below).
4. Return to this lab and right-click on the corn cob photos (on the following pages) to save copies of the images. Use ImageJ (File --> Open...) to open the photo that you want to count kernels on.
5. From the ImageJ Plugins drop-down menu, go to Analyze --> Cell Counter. The Cell Counter dialog box will appear. Click on the Initialize button. (If you don't, you'll be prompted to do so.)
6. Choose the Type 1 counter, then move your mouse over to the corn photo and start clicking on the individual kernel types you want to count. You just have to click on kernels; the Cell Counter will keep a running tally in the box adjacent to 'Type 1'. When you're finished clicking on 5 rows' worth of kernels, note the total in the Cell Counter.
7. Switch to the Type 2 counter and count up the next type of kernels. Note the total in the Cell Counter dialog box.
8. Continue as necessary until you have counted all of the different types of kernels you need to.
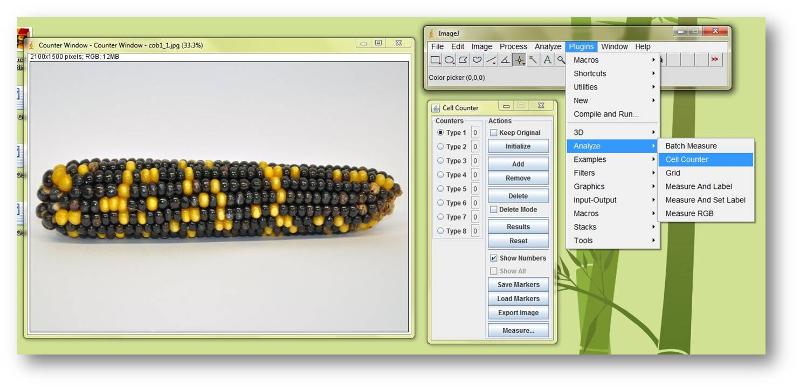
ImageJ screen capture by Jennifer Van Dommelen
Two true breeding strains of corn were crossed, one with purple kernels and one with yellow kernels. The F1 offspring from this cross are found on Cob 4. Click on the Cob 4 thumbnail to view a high-resolution version of the entire cob.
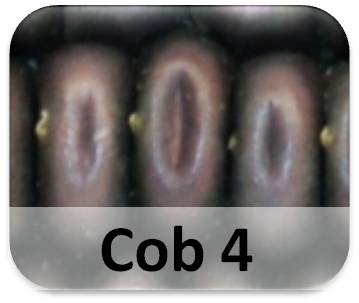
We will start by assuming that purple colour is dominant over yellow colour in corn. If we treat kernel colour as a single-gene trait, we can symbolize this relationship: D represents the dominant (purple) allele, and d represents the recessive (yellow) allele. Answer the questions for this section in the assignment document that you downloaded for this lab.
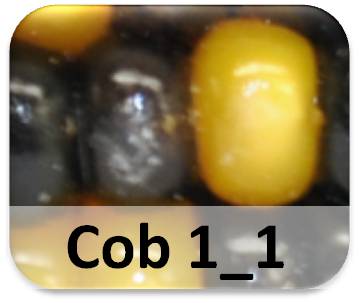
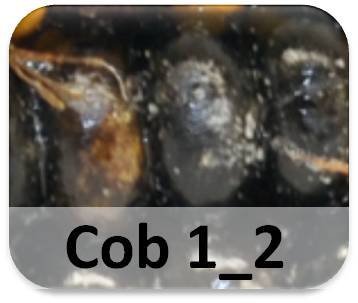
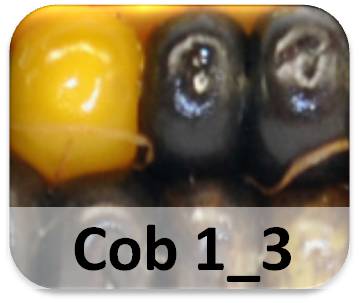
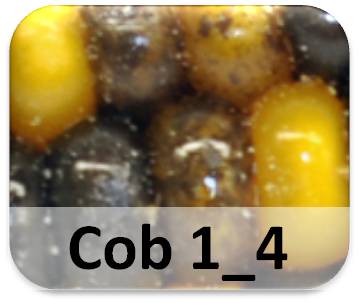
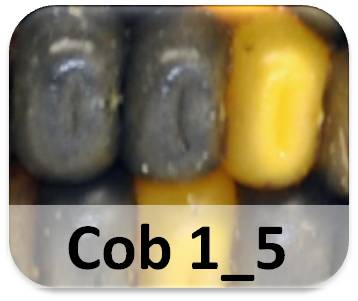
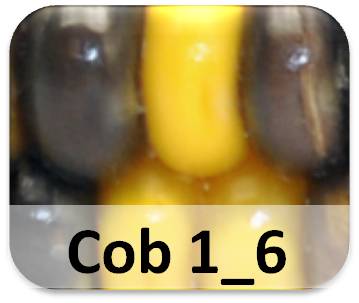
An appropriate test of your hypothesis about the genotype of the Cob 4 kernels is to cross individuals from this generation; this cross will yield an F2 generation of offspring. In order to test your hypothesis, you will need to study a large group of offspring. Six pairs of Cob 4 kernels were crossed, each cross yielding a 'Cob 1'; the results are pictured below. Click on the thumbnails to view high-resolution versions of whole cobs. Save a copy of each high-res photo on your computer. For each whole cob, count 5 rows of kernels and note the number of purple and yellow kernels (use ImageJ; instructions on previous page). Print this page or draw the table below in your notes to record your observations. For kernels that appear to be a combination of purple and yellow, use your judgement as to whether the kernel is more purple or more yellow and count it accordingly.
|
|
|
|
|
|
|
|
|
|
number of kernels |
||||||
|
Phenotype |
Cob 1_1 |
Cob 1_2 |
Cob 1_3 |
Cob 1_4 |
Cob 1_5 |
Cob 1_6 |
TOTAL |
|
purple |
|
|
|
|
|
|
|
|
yellow |
|
|
|
|
|
|
|
|
TOTAL |
|
|
|
|
|
|
|
The numbers of kernels of each phenotype that you count will probably not match up with an exact Mendelian ratio. But what is the reason for this difference between what you actually observed and what you predicted that you would observe? Is this difference due to chance (or what we might call sampling error), or is it due to your hypothesis being incorrect? If this difference between what was observed and what was expected is likely due to an incorrect hypothesis, then we will want to know that so we can reject our hypothesis. If the difference is likely due to chance alone, then we will not reject our hypothesis.
Geneticists use a statistical test called the chi-squared test to judge how close the expected and observed ratios are. The chi-squared test is a test of goodness of fit - that is, how well do the observations fit with what was expected? Even if the hypothesis is correct, the fit won't be perfect: observed numbers will almost always differ from predicted numbers at least a little, due to the effects of chance. For example: you counted five rows of kernels on six different cobs to get your results. What if you'd counted a different five rows? Your observed results would likely be a little bit different. The chi-squared test is a way to determine whether these differences between what you observed and what you expected are significant - that is, due to a problem with your hypothesis - or not significant -- that is, just due to chance.
Read the Statistics In Introductory Biology document for instructions on how to perform the chi-square statistical test on your data. Complete the table in your assignment document.
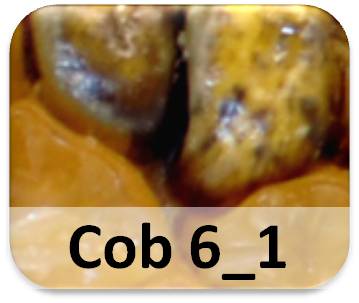
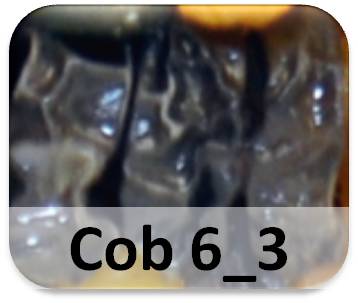
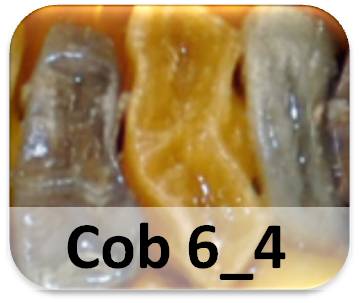
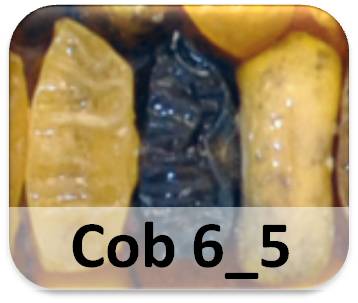
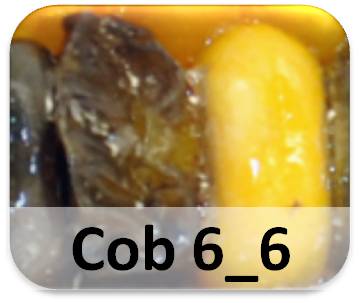
The photos on this page represent six examples of Cob 6, each of which contains the offspring of the same type of two-gene cross. There are four different phenotypes among the Cob 6 kernels: purple and smooth (genotype D_N_), purple and wrinkled (genotype D_nn), yellow and smooth (genotype ddN_),and yellow and wrinkled (genotype ddnn).
Answer the questions in your assignment document about a hypothesis and prediction regarding Cob 6.
As you did for Cob 1, use ImageJ to count five rows of kernels on each Cob 6 and record your observations in your notes. For kernels that appear to be a combination of purple and yellow, use your judgement as to whether the kernel is more purple or more yellow and count it accordingly. It may feel like you are counting a lot of kernels, but this is still quite a small sample size for your statistical analysis. Use your data to complete the chi-squared table and answer the remaining questions in your assignment document.
|
|
|
|
|
|
|
|
|
|
number of kernels |
||||||
|
phenotype |
Cob 6_1 |
Cob 6_2 |
Cob 6_3 |
Cob 6_4 |
Cob 6_5 |
Cob 6_6 |
TOTAL |
|
purple, smooth |
|
|
|
|
|
|
|
|
purple, wrinkled |
|
|
|
|
|
|
|
|
yellow, smooth |
|
|
|
|
|
|
|
|
yellow, wrinkled |
|
|
|
|
|
|
|
|
TOTAL |
|
|
|
|
|
|
|
This is the end of the lab - we hope you had fun with the corn babies!