

One-Gene Cross
Two true breeding strains of corn were crossed, one with purple kernels and one with yellow kernels. The F1 offspring from this cross are found on Cob 4. Click on the Cob 4 thumbnail to view a high-resolution version of the entire cob.
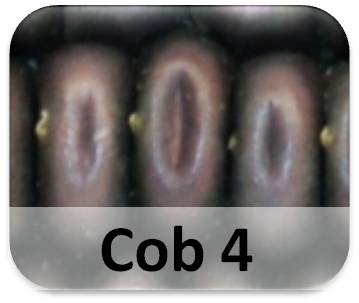
We will start by assuming that purple colour is dominant over yellow colour in corn. If we treat kernel colour as a single-gene trait, we can symbolize this relationship: D represents the dominant (purple) allele, and d represents the recessive (yellow) allele. Answer the questions for this section in the assignment document that you downloaded for this lab.
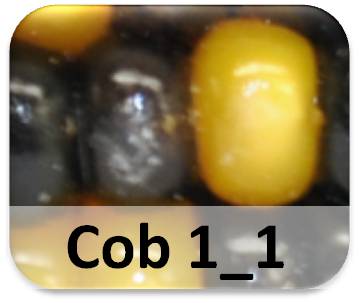
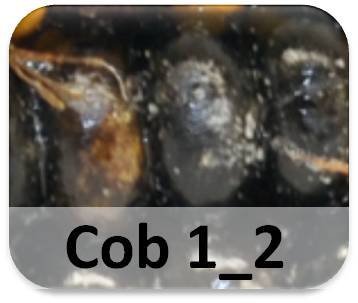
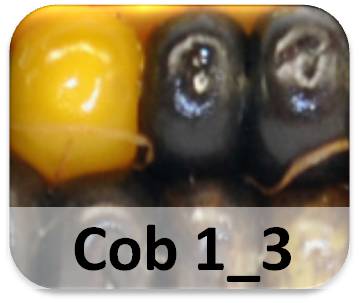
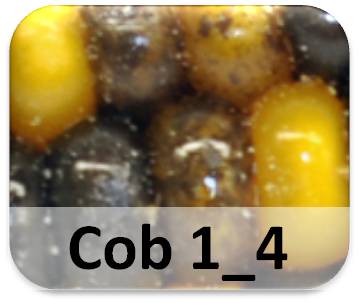
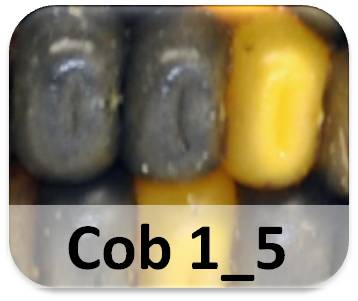
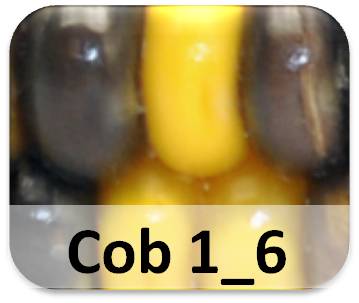
An appropriate test of your hypothesis about the genotype of the Cob 4 kernels is to cross individuals from this generation; this cross will yield an F2 generation of offspring. In order to test your hypothesis, you will need to study a large group of offspring. Six pairs of Cob 4 kernels were crossed, each cross yielding a 'Cob 1'; the results are pictured below. Click on the thumbnails to view high-resolution versions of whole cobs. Save a copy of each high-res photo on your computer. For each whole cob, count 5 rows of kernels and note the number of purple and yellow kernels (use ImageJ; instructions on previous page). Print this page or draw the table below in your notes to record your observations. For kernels that appear to be a combination of purple and yellow, use your judgement as to whether the kernel is more purple or more yellow and count it accordingly.
|
|
|
|
|
|
|
|
|
|
number of kernels |
||||||
|
Phenotype |
Cob 1_1 |
Cob 1_2 |
Cob 1_3 |
Cob 1_4 |
Cob 1_5 |
Cob 1_6 |
TOTAL |
|
purple |
|
|
|
|
|
|
|
|
yellow |
|
|
|
|
|
|
|
|
TOTAL |
|
|
|
|
|
|
|
The Chi-Squared Test: Comparing What You Observed to What You Predicted
The numbers of kernels of each phenotype that you count will probably not match up with an exact Mendelian ratio. But what is the reason for this difference between what you actually observed and what you predicted that you would observe? Is this difference due to chance (or what we might call sampling error), or is it due to your hypothesis being incorrect? If this difference between what was observed and what was expected is likely due to an incorrect hypothesis, then we will want to know that so we can reject our hypothesis. If the difference is likely due to chance alone, then we will not reject our hypothesis.
Geneticists use a statistical test called the chi-squared test to judge how close the expected and observed ratios are. The chi-squared test is a test of goodness of fit - that is, how well do the observations fit with what was expected? Even if the hypothesis is correct, the fit won't be perfect: observed numbers will almost always differ from predicted numbers at least a little, due to the effects of chance. For example: you counted five rows of kernels on six different cobs to get your results. What if you'd counted a different five rows? Your observed results would likely be a little bit different. The chi-squared test is a way to determine whether these differences between what you observed and what you expected are significant - that is, due to a problem with your hypothesis - or not significant -- that is, just due to chance.
Read the Statistics In Introductory Biology document for instructions on how to perform the chi-square statistical test on your data. Complete the table in your assignment document.